A while ago I wrote a small script which runs benchmarks against given filesystems and collects performance data for each run. What I wanted to find out is, how expensive (IO-wise) various standard filesystem operations are.
The collected informations proved to be quite extensive and very hard to visualize.
But why?!
I always wondered how much faster a given filesystem is for specific tasks and more importantly - why?
Some dogmas which exist are:
- ext2 is fast for sequential I/O
- reiserfs is fast for handling many small files
- xfs is fast for deletes
- everything except the ext* family of filesystems will eat your data for breakfast at the slightest chance of blockdevice or kernel issues
but will those live up to scrutiny?
The benchmarks
What I did was to define some basic isolated filesystem workloads which are supposed to benchmark different areas of a given filesystem. What I came up with was:
- write a 4GB file with cp
- read a 4GB file with cp
- delete a 4GB file
- create many files (untar 2.6.[0,5,10,15,20,25] linux sources)
- read many files (rsync given files to an empty directory)
- stat many files (rsync given files to the previously filled directory)
- delete many files (delete given files)
The tested filesystem was unmounted between each run to simulate cold caches. I collected the extended io statistics from /proc/diskstats, the interesting bits being the amount of IOs and the sectors read/written during the run as well as the total duration.
The system I used for testing is a Athlon64 X2, running Debian Lenny with stock kernel. The filesystems were created on a very dated Seagate Barracuda 7200.7.
Although these tests are highly unscientific1 they already yielded some very interesting, and much more importantly, reproducible results.
The data
A sample result set from one benchmark run can be found here. If you've got a high pain threshold (and/or a soft spot for raw numbers) you can already deduce some interesting facts from this list, e.g. that ext4 is much faster than ext3 for most operations, or that xfs is embarrassingly slow when creating many files. But to get a big picture of what's going on here you need to visualize the data.
I did a bit of sketching and came up with something like this:
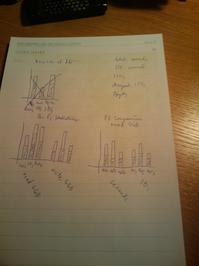
I wanted to stack identical units (e.g. read & write IOs or read & written sectors) to form a single bar and preserve space this way. Additionally I wanted to group the bars together to make comparison easier and improve the overall graph layout. To make things even more complicated I wanted to combine three different units (IOs, bytes and seconds) on a single graph.
After a bit of reading I found out that the result is supposedly called a "grouped, stacked bar graph with variable y axes". That was my goal.
Tools of trade
Having hardly any experience with data visualization I turned to gnuplot and got disappointed. Only up to two axes per graph and dimension, sparse documentation for the things I wanted to achieve and a mailinglist which never accepted my "anonymous" Gmane post which was stuck in the moderation queue.
The various Flash rendering frameworks like Google Chart seemed promising but didn't live up to my rather specific expectations.
Then a friend of mine pointed me to SigmaPlot which he used for his diploma thesis and spoke highly of.
I gave it a try, and after a bit of trial and error (and dropping the stacked bar requirement) I had my first graphs. Implementing multiple axes isn't too easy with SigmaPlot either (and seems very "bolted on" rather than nicely integrated), but at least I had my first visualized data sets.
The results
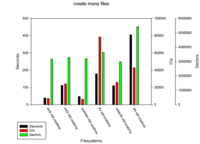
This graph was the first I did and was grouped by filesystem because this was much easier to accomplish.
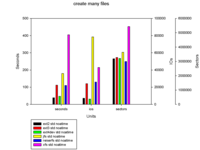
The second graph resembles the one I drafted in the beginning, minus the stacked bar graphs (which is a pity, since there's interesting information lost2).
So what do these graphs tell us? For the given test case (create a few hundred thousand files):
- ext4's performance is almost identical to ext2's, which is great to hear
- The amount of sectors need to be read and written are pretty closely grouped except for xfs (with reiserfs setting the lower boundary)
- for the ext* family and reiserfs the amount of IOs correlated with the overall runtime
- Both xfs and jfs seem unsuitable for general usage, at least with standard mkfs and mount parameters on Debian Lenny.
And now?
To be honest, I'm not too fond of the results I got. The amount of time necessary to get the graphs in question seems prohibitively high. Also, the results will never satisfy all people since they're rather static and may contain too much "noise" or not the right combination of data points for a given question you want to answer.3
If you've got any suggestions on different tools or approaches these would be highly appreciated.
And if I don't get any new input I'll eventually re-run the benchmarks with a more recent kernel (adding a stable ext4 and btrfs to the mix), check if the jfs and xfs results are representative and last but not least average a few iterations and increase the working set to get solid results.
And always remember:

toothpastefordinner.com
Scripts, etc.
In case you want to run your own benchmarks, you can find the highly undocumented and uncommented scripts here. Basic instructions for creating the graphs with SigmaPlot can be found here.
Footnotes
1 What's the buffer size which cp uses for copying? Am I stalled by reading/writing from/to the "helper" filesystems? Are the collected numbers representative for "normal" usage with warm caches?
2 E.g. "How many read IOs does a filesystem need to do to delete a single large file?"
3 Interestingly these are similar issues which you will also have when comparing tools like Munin and Zabbix. The former is rather easy to set up but will bite you when you try the simplest form of data correlation, especially for older data sets. The latter is a huge PITA to set up but offers very sophisticated and dynamic tools for data analysis and correlation.