After discovering the level of insight you can gain into Linux systems with the "new" Disk I/O statistics as provided by iostat I wondered why there weren't any sane munin plugins which utilize this data, since this ought to be very easy task to accomplish.
Having a few days to kill (being down with stomach flu back then) I decided to write a plugin on my own. I'll provide an annotated example of what the data looks like and why having this kind of information is A Good Thing.
An example
Imagine you run a public server which offers data over HTTP, FTP and rsync. The utilization looks fine and there's ample room to grow. But one day, those crazy germans1 decide to release a new version of OpenSUSE and things suddenly look quite different.
1 No offense meant, it's just that me growing up with british & american media shows it's first signs ;).
Looking at the graphs

Probably the most impressive change directly noticeable after the release is the increased network traffic. After a short run for 700Mbit on the first day we still hit the 300Mbit barrier on a daily basis.
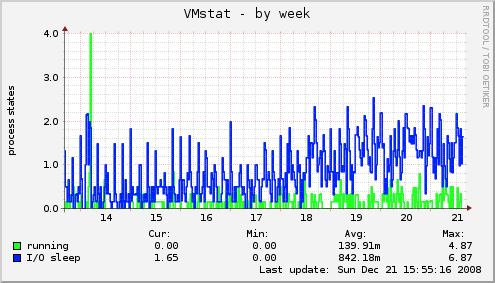
The vmstat graph shows an increased amount of processes waiting for I/O which is not entirely unexpected, given the higher amount of requests and traffic.
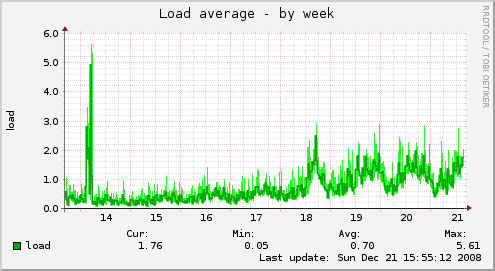
And those blocked processes are directly visible in the "Load" trend too. The numberes are not worrying but we're interested what this means for the overall system performance.
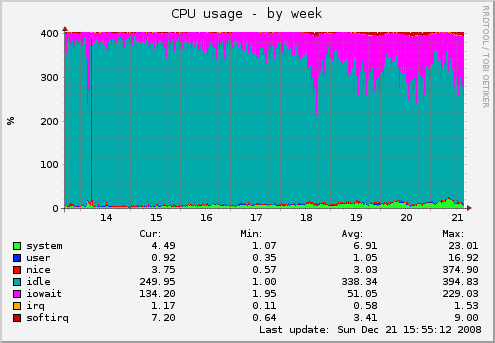
The CPU graphs show a much more worrying picture. There's regularly more than one core worth of processes waiting for I/O, shooting for half the available CPU resources on the day of the release.
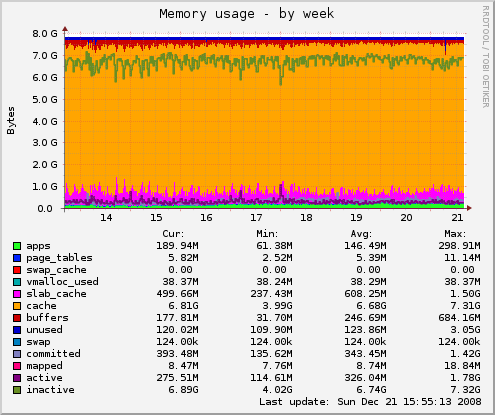
A quick glance at the memory status shows, that there's nearly all memory dedicated to caching various aspects of the OS (Filesystem Metadata, Page cache for file content, etc.) and no swapping takes place.
Normally you'd have to say "Well, I hope the machine can keep up" and can only make highly abstracted guesses on how System Load and CPUs waiting for I/O might reflect on overall system performance and available reserves. But with Diskstats we can gain much more insight on what is going on on blockdevice level.
Bring on the diskstats!
For the sake of clarity I'll show only the statistics of one of the blockdevices involved. The server in questions has an Areca SATA RAID controller with 8 disks, which are split in two 4-Disk RAID5 components, over which I created a striped LVM2 volume resulting in a "multi-tiered" RAID5+0. This means that each of the RAID5 components receives roughly the same amount of read and write requests.
Throughput
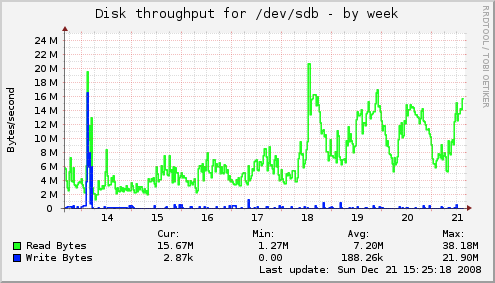
The most simple, best known and least interesting (from a performance PoV) I/O graph shows the "throughput" of a given blockdevice.
One thing we can extrapolate from the graphs though, is that the Page Cache is working. If we take the peak from the 19th, which is about 17MiB/sec, take it times two for the other RAID component we get a peak of 34MiB/sec. If we convert2 this to MBit/sec:
34 * 8 * 1024^2 / 1000^2we get roughly 285 MBit/sec worth of data (completely ignoring metadata and other overhead) which was read from the disks. When looking at the network graphs we see that we peaked around 370MBit/sec in the given time window, so there's a noticeable difference between data read from disk and data sent over the network, which has been served from the memory.
2 Disk I/O is measured in powers of 2 and network traffic in powers of 10. The larger the prefix, the worse the difference. See Binary Prefix at the Free Encyclopedia.
I/Os
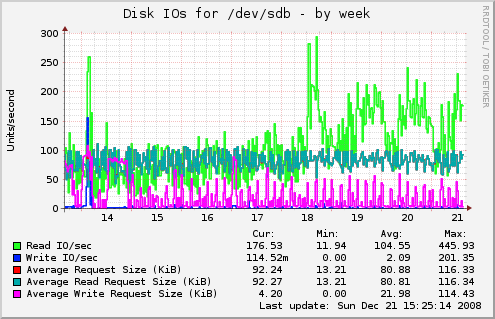
Looking at the amount of I/O operations taking place, we see that the overall picture is pretty much unchanged, except the amount of Read operations taking place. The range of the average read request size became a bit narrower, but that's about it.
Latency
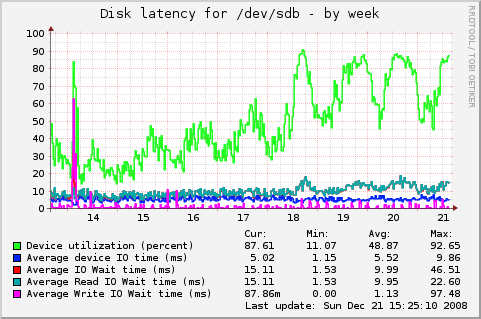
And this graph finally contains the most interesting information when it comes to performance. Write latency seems to be completely unfazed by the higher disk utilization but we can see that the average read latency nearly doubled from ~8ms to ~15ms. And we see that the device utilization (or: "Amount of time spent doing I/O") is dangerously close to 100%. When a device hits 100% utilization it means that new requests can't be fulfilled in a timely manner but have to be queued.
And one thing I forget to tell.
One of the 4-Disk groups does not only contain the volume where the downloadable content is but also the root filesystem, which is a constant source of writes (log files et al) among other I/O operations, slowing the blockdevice (sdd in our case) "behind the scenes".
An
iostat -x -k 15 sdb sdd dm-4shows:
avg-cpu:  %user   %nice %system %iowait  %steal   %idle
           0.79    1.23    3.89   43.73    0.00   50.36

Device:         rrqm/s   wrqm/s     r/s     w/s    rkB/s    wkB/s avgrq-sz avgqu-sz   await  svctm  %util
sdb             270.60     0.00  217.40    0.00 13932.00     0.00   128.17     2.38   10.94   4.02  87.41
sdd             294.33     0.00  229.13    0.00 13948.27     0.00   121.75     2.62   11.44   4.05  92.72
dm-4              0.00     0.00  614.40    0.00 27914.40     0.00    90.87     8.73   14.20   1.62  99.79
where we can clearly see that the striped LVM volume is already maxing out with the current I/O. This also means that the amount of data which can be sent is no longer limited by the available bandwidth to the clients but the disks serving the data.
Where the I/O bias towards sdd comes from is beyond my knowledge so far, either it's some details in the LVM striping I have overlooked or an interaction between stripe size and FS metadata layout.
And before you ask - graphing of devicemapper devices is already on my ToDo list ;).
To sum it up
Linux Diskstats give you the details you need when you suspect that you're going to get disk-bound on any of your servers. It shows exactly what is going on at block device level and offers direct comparison between different controllers, disks and setups (given the system utilization is identical).
I'm sold. Where do I have to sign?
Visit https://github.com/terrorobe/munin-plugins, there'll you find all information necessary to get and use the plugin.
A live installation of the plugin can be seen at mirror.inode.at.
[Update 2009-11-30]
The plugin is also available in the munin-plugins-extra package in the upcoming Debian Squeeze release. It was also merged by munin upstream and will be is included as "manual" module in the upcoming 1.4.0 release.
Thank you for making a great munin plugin!
I was looking for a detailed disk IO monitoring tool and finally I found this page.